Monitoring The Photovoltaics
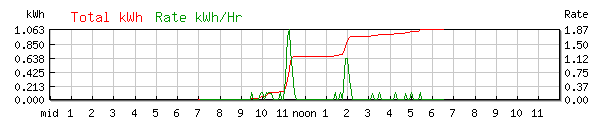
Today's Power Generation Graph
Our photovoltaic installation has a kilowatt-hour meter attached, just like the one the electric company uses to see how much energy your house uses, but it's hooked up so that we can see just how much electricity our system is generating. We're putting those figures up here to see how it relates to the energy being used by our Solectria Force EV.
| Date | Meter Reading | PV Generation This Period (kWh) |
Car Usage This Period (kWh) |
Net Generation (kWh)** This Period |
Net Generation (kWh)** Overall |
| 5/24/99 | 0 | --- | --- | --- | --- |
| 6/1/99 | 42 | 42 | 26* | 16 | 16 |
| 7/1/99 | 185 | 143 | 143 | 0 | 16 |
| 8/1/99 | 349 | 164 | 81 | 83 | 99 |
| 9/1/99 | 495 | 146 | 132 | 14 | 113 |
| 10/1/99 | 618 | 123 | 77 | 46 | 159 |
| 11/1/99 | 706 | 88 | 100 | -12 | 147 |
| 12/1/99 | 758 | 52 | 110 | -58 | 89 |
| 1/1/00 | 796 | 38 | 153 | -115 | -26 |
| 2/1/00 | 819 | 23 | 126 | -103 | -129 |
| 3/1/00 | 874 | 55 | 161 | -106 | -235 |
| 4/1/00 | 970 | 96 | 105 | -9 | -244 |
| 5/1/00 | 1094 | 124 | 102 | 22 | -222 |
| 6/1/00 | 1211 | 117 | 54 | 63 | -159 |
| 7/1/00 | 1356 | 145 | 81 | 64 | -95 |
| 8/1/00 | 1501 | 145 | 77 | 68 | -27 |
| 9/1/00 | 1638 | 137 | 41 | 96 | 69 |
| 10/1/00 | 1727 | 89 | 62 | 27 | 96 |
| 12/1/00 | 1844 | 117 | 178 | -61 | 35 |
| 1/1/01 | 1850 | 6 | 95 | -89 | -54 |
| 2/1/01 | 1889 | 39 | 91 | -52 | -106 |
| 3/1/01 | 1942 | 53 | 75 | -22 | -128 |
| 4/1/01 | 2045 | 103 | 98 | 5 | -123 |
| 5/1/01 | 2176 | 131 | -- | 131 | 8 |
| 6/1/01 | 2296 | 120 | -- | 120 | 128 |
| 7/1/01 | 2420 | 124 | -- | 124 | 252 |
| 8/1/01 | 2582 | 162 | -- | 162 | 414 |
| 9/1/01 | 2706 | 124 | -- | 124 | 538 |
| - | - | - | - | - | - |
| 10/1/02 | 3905 | 110 | 68 | 42 | 854 |
| 11/1/02 | 3960 | 55 | 88 | -33 | 821 |
| 12/1/02 | 4002 | 42 | 149 | -107 | 714 |
| 1/1/03 | 4027 | 25 | 147 | -122 | 592 |
| 2/1/03 | 4070 | 43 | 146 | -103 | 489 |
| 3/1/03 | 4138 | 68 | 76 | -8 | 481 |
| 4/1/03 | 4226 | 88 | 81 | 7 | 488 |
| 5/1/03 | 4339 | 113 | 87 | 26 | 514 |
* Based on 7 days at 6/1/99 usage rate
** Positive numbers indicate PV system exceeding car usage, negative indicate car
exceeding PV system
Update 1/23/03 -- Just updated the chart. The car was offline until summertime and I didn't start reading the meter again until September.
Update 8/1/01 -- The last few months, the panels have been outputting energy even though the electric car hasn't been charging (it's being upgraded to new batteries and we're waiting on the last components to show up to complete the conversion). As a result, we're showing a considerable surplus.
Update 1/1/01 -- Probably a worst-case scenario, with the snowiest December on record for us, we generated only 6kWh. This was due to a lot of overcast days and repeated heavy snows, and I didn't get a chance to clear the snow off the panels. Must be more prompt to clear the panels in the future...
Update 5/1/00 -- We're now back into power surplus territory, with the PV system generating 22 more kWh than the car used last month.
Update 1/1/00 -- We've moved into a power deficit, as expected. Winter sunlight doesn't provide as much energy as in summer, and the electric car uses more energy for its electric heat. This should be a worst-case scenario, however, as the days now begin to get longer. We'll probably continue to have a power deficit until late Spring, when the system will start providing much more power.
Update 10/1/99 -- We're now seeing production fall off somewhat as we move into Autumn. The panels were raised into their winter positions on September 30, allowing them to collect more of the sun's rays as it moves toward the south. Cooler temperatures should help offset the shorter days, as the panels are more efficient at generating electricity when they are cool.
Update 7/1/99 -- Wow! This month, I drove the car to the Midwest Renewable Energy Association energy fair in Amherst, Wisconsin -- A 300-mile round trip. This pushed our miles traveled this month to a record 731 (our average is 365 per month). Even with this extreme amount of usage, the PV system was able to cover it -- exactly! If this had been a normal month, the PV system would have generated almost double the amount needed by the EV.
What The Numbers Mean
Every month, we read the meters attached to the photovoltaic array and our Solectria Force EV and enter the values into a spreadsheet which computes several values:
kWh Generated This Period -- The actual amount of electricity generated in the past month by the PV array and output to the house, in kilowatt-hours.
Car Usage This Period -- The actual amount of electricity used by the car in the past month, in kilowatt-hours.
Net Generation (kWh) This Period -- If this number is positive, the PV array generated more electricity in the past month than the car used. We hope this will always be the case, but in winter months it may not, in which case the numbers will be in parentheses, indicating a deficit.
Net Generation (kWh) Overall -- The running generation statistics for the PV system over its life. Once again, we hope this will always be a positive number. If it is not, we may expand the PV system to increase generation capacity.